Biden approval rating polls
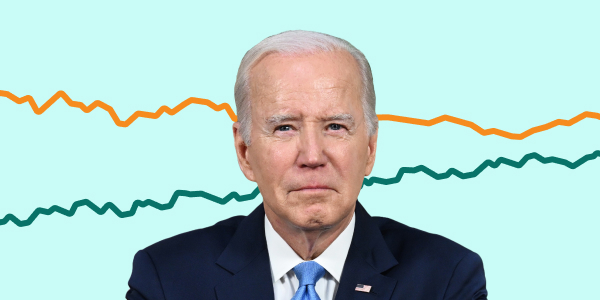
Biden has a 41.5% approval rating based on 1,610 polls.
Nov 22, 2024
Disapprove
55.0%
Approve
41.5%
Estimate
95% of polls fall in this range
A bit of background... President Joe Biden's job approval rating is a key barometer of public sentiment, reflecting the nation's reception of his tenure and policies. As Biden positions himself for reelection, his approval rating is scrutinized for indications of the electorate's continued support or desire for change. This metric is central to understanding the political climate and forecasting the challenges or advantages Biden may face in securing a second term.
1,610 polls
Latest Poll: Tue, Nov 5, 3:53 AM EST
Field Dates | Sample | Pollster | Results | Topline |
|---|---|---|---|---|
| Nov 4 – 5 | 2,703 LV | AtlasIntel | 54.6%Disapprove 41.6%Approve | +13 Disapprove |
| Nov 3 – 4 | 1,003 LV | Research Co. | 53.0%Disapprove 45.0%Approve | +8 Disapprove |
| Nov 2 – 4 | 1,242 Adults | Ipsos | 57.0%Disapprove 37.0%Approve | +20 Disapprove |
| Nov 2 – 3 | 2,463 LV | AtlasIntel | 55.5%Disapprove 39.5%Approve | +16 Disapprove |
| Nov 1 – 3 | 1,446 RV | Marist College Poll/... | 55.0%Disapprove 41.0%Approve | +14 Disapprove |
| Oct 31 – Nov 3 | 3,759 LV | HarrisX/Forbes | 57.0%Disapprove 41.0%Approve | +16 Disapprove |
| Oct 31 – Nov 3 | 1,000 RV | Hart Research/Public... | 58.0%Disapprove 41.0%Approve | +17 Disapprove |
| Oct 31 – Nov 3 | 1,000 LV | Emerson College Poll... | 52.5%Disapprove 40.1%Approve | +12 Disapprove |
| Oct 31 – Nov 1 | 3,490 LV | AtlasIntel | 54.7%Disapprove 40.4%Approve | +14 Disapprove |
| Oct 30 – Nov 1 | 1,074 LV | YouGov/Yahoo News | 56.0%Disapprove 43.0%Approve | +13 Disapprove |
+ More Polls
The polling bias for the 2016 and 2020 Presidential elections is based on analysis from the American Association of Public Opinion Research (AAPOR) comparing actual results to national polls. For the 2018 and 2022 elections, bias was measured by comparing FiveThirtyEight's Generic Ballot polling average with the adjusted US House National Popular vote, using data from the UVA Center for Politics (2018) and DecisionDeskHQ (2022).