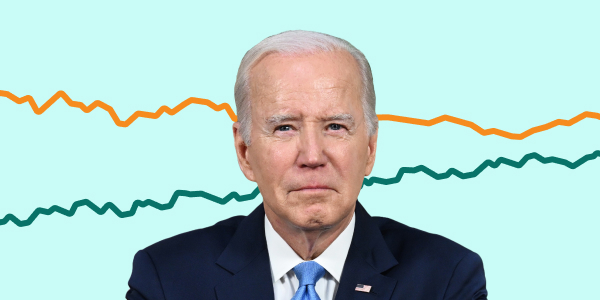
Biden favorable / unfavorable ratings
Biden has a 42.8% favorability rating based on 511 polls.
Sep 19, 2024
Unfavorable
56.1%
Favorable
42.8%
Estimate
95% of polls fall in this range
A bit of background... President Joe Biden's favorability index tracks voters' feelings toward the president as his campaign for reelection as President of the United States continues. Presidents with a greater favorability rating likely have a greater chance of winning reelection, as voters are satisfied with their current leadership.
511 polls
Latest Poll: Wed, Sep 18, 3:26 PM EDT
Field Dates | Sample | Pollster | Results | Topline |
|---|---|---|---|---|
| Sep 16 – 18 | 1,442 RV | YouGov/The Economist | 55.0%Unfavorable 45.0%Favorable | +10 Unfavorable |
| Sep 14 – 17 | 1,102 RV | Beacon Research/Shaw... | 58.0%Unfavorable 41.0%Favorable | +17 Unfavorable |
| Sep 12 – 16 | 803 RV | Monmouth University ... | 60.0%Unfavorable 39.0%Favorable | +21 Unfavorable |
| Sep 13 – 14 | 1,283 LV | Data for Progress | 55.0%Unfavorable 44.0%Favorable | +11 Unfavorable |
| Sep 12 – 14 | 1,755 Adults | YouGov/Yahoo News | 56.0%Unfavorable 41.0%Favorable | +15 Unfavorable |
| Sep 12 – 14 | 3,018 RV | HarrisX/Forbes | 53.0%Unfavorable 42.0%Favorable | +11 Unfavorable |
| Sep 12 – 14 | 1,721 RV | TIPP Insights | 54.0%Unfavorable 38.0%Favorable | +16 Unfavorable |
| Sep 12 – 13 | 1,775 LV | AtlasIntel | 53.0%Unfavorable 39.0%Favorable | +14 Unfavorable |
| Sep 9 – 11 | 1,460 RV | YouGov/The Economist | 56.0%Unfavorable 43.0%Favorable | +13 Unfavorable |
| Sep 5 – 6 | 2,358 RV | HarrisX/Harris Poll/... | 53.0%Unfavorable 42.0%Favorable | +11 Unfavorable |
+ More Polls
The polling bias for the 2016 and 2020 Presidential elections is based on analysis from the American Association of Public Opinion Research (AAPOR) comparing actual results to national polls. For the 2018 and 2022 elections, bias was measured by comparing FiveThirtyEight's Generic Ballot polling average with the adjusted US House National Popular vote, using data from the UVA Center for Politics (2018) and DecisionDeskHQ (2022).