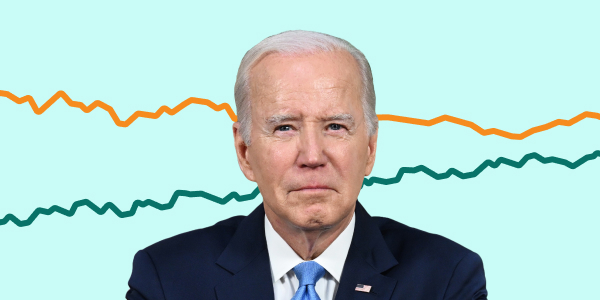
Generic ballot polls
Democrats have a 0.3% lead based on 587 polls.
Nov 22, 2024
Democrat
46.0%
Republican
45.7%
Estimate
95% of polls fall in this range
Polling average unskewer
Our 'unskewer' is a way to adjust for whatever bias you think is reflected in the polls. For example, if a Republican candidate is at 44% and a Democrat is at 42%, slide our 'unskewer' 2 point to the left and it will reduce the Republican candidate's margin by 2 points.
Dem. +0.3
Original Avg.
Dem. +0.3
Adjusted Avg.
Reset
A bit of background... The generic ballot serves as a crucial predictor for the battle over control of the US House of Representatives, offering a snapshot of national party preference between Republicans and Democrats. Following a narrow Republican majority win in the 2022 midterms, this gauge provides insights into potential shifts in legislative power. It reflects the natural political environment of the nation as a whole, without considering specific candidates or politicians.
587 polls
Latest Poll: Tue, Nov 5, 3:53 AM EST
Field Dates | Sample | Pollster | Results | Topline |
|---|---|---|---|---|
| Nov 3 – 4 | 1,005 LV | John Zogby Strategie... | 46.1%Democrat 44.7%Republican | +1 Democrat |
| Nov 1 – 3 | 1,297 LV | Marist College Poll/... | 50.0%Democrat 48.0%Republican | +2 Democrat |
| Oct 31 – Nov 3 | 1,000 RV | Hart Research/Public... | 47.0%Democrat 46.0%Republican | +1 Democrat |
| Oct 31 – Nov 3 | 3,759 LV | HarrisX/Forbes | 46.0%Democrat 46.0%Republican | TIE |
| Oct 31 – Nov 3 | 1,000 LV | Emerson College Poll... | 48.2%Democrat 47.1%Republican | +1 Democrat |
| Oct 31 – Nov 2 | 1,088 LV | Targoz Market Resear... | 47.0%Democrat 44.0%Republican | +3 Democrat |
| Nov 1 | 671 RV | Kaplan Strategies | 45.0%Republican 44.0%Democrat | +1 Republican |
| Oct 30 – Nov 1 | 1,073 LV | YouGov/Yahoo News | 48.0%Democrat 45.0%Republican | +3 Democrat |
| Oct 29 – Nov 1 | 1,328 LV | Echelon Insights | 48.0%Republican 47.0%Democrat | +1 Republican |
| Oct 29 – 31 | 800 LV | OnMessage Inc./ Sena... | 45.0%Republican 44.0%Democrat | +1 Republican |
+ More Polls
The polling bias for the 2016 and 2020 Presidential elections is based on analysis from the American Association of Public Opinion Research (AAPOR) comparing actual results to national polls. For the 2018 and 2022 elections, bias was measured by comparing FiveThirtyEight's Generic Ballot polling average with the adjusted US House National Popular vote, using data from the UVA Center for Politics (2018) and DecisionDeskHQ (2022).